Posts

Quality Management in PMBOK

Image
 Quality Management in PMBOK As per PMBOK (Project Management Body of Knowledge), Quality Management is one of the 10 knowledge areas and used in 3 project process. 1. Plan Quality  During the planning phase of project. 2. Manage Quality  During the execution phase of project. 3. Control Quality During the control and monitoring phase of project.

Types of Organization in Project Management

Image
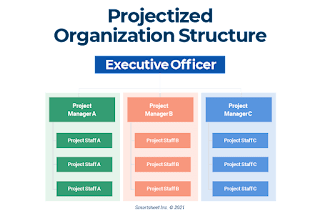
 Organizational Structure: It is a system that outlines how certain activities are assigned/directed in order to achieve the target and objectives of a company/organization. Types: 1. Projectized Organization An organization where project managers has highest authority to assign resources for work. It lasts for a project and project manager is held responsible for all the actions.  2. Functional Organization An organization where work is assigned based on the specialized field. HR, Finance, Market, Research etc. are made different departments and employees report to their functional managers. Matrix Organization: It is type of an organization which is mixture of both project and functional organizations. Some of the tasks are assigned by functional managers and some specific project related tasks are assigned by project managers. 

Critical Path Method

Image
 Critical Path Method Critical path method is a technique used in project scheduling. It is a longest path of sequenced activities in scheduling which has to be completed within time to avoid any delays. Steps in CPM: 1. Define project and prepare work breakdown structure. 2. Develop relationship among activities and decide predecessors and successor activities, 3. Draw network connecting all the activities. 4. Assign Time and cost estimates. 5. Compute longest time path, this is called critical path. 6. Use this network to plan, schedule and control project.  

Quality Control Tools

Image
 There are 7 types of Quality Control Systems. 1. Check Sheets A document which is used to collect the real time data at a place where data is generated. 2. Histogram Frequency Diagram, It reflects shape, location and trends. 3. Pareto Diagram It separates the vital few from trivial many. Based on Pareto law of 20/80. 4. Ishikawa/Cause-Effect Diagram If a problem is found then its cause and effect diagram is generated based on 4 problems man, machine, method and material. Also called fish bone diagram. 5. Stratification: To generate data of different origins. 6. Scatter Diagram It explains how process characteristics are affected with the influence of external variable. 7. Control Charts A control chart shows process data over time, process mean is plotted. Upper and lower limits of control are reflected.

Project Management Basics

Image
  Project Management Basics Project: A project is a temporary endeavor, unique and has start to finish date. It operates within given time, scope and budget. Project Management: Project management is a process or technique used to achieve the defined goals or deliverables in project scope within triple constraints of time, cost and scope. Project Management Processes: There are five process groups, also called project lifecycle. These are  1. Initiation 2. Planning 3. Execution 4. Control and Monitoring  5. Closing  Project Knowledge Areas: There are 10 Knowledge areas.

7 Laws of Quality Management

Image
  As a project manager, some situations are inevitable to face in life. These are some of the situations described as laws which could prove effective in project life. 1. Murphy's Law  "Anything that can go wrong, will go wrong."  This law is also called Law of Toasted Bread. By keeping this law in mind, a project manager will always keep in mind the worst case scenarios and will be prepared for them. 2. Pareto's Principle Also called the 80-20 Law as well. It means the 80% effects are result of 20% causes. Or 80% of the productivity is because of 20% of resources. This law will help to prioritize the work as per their effect on project.  3. Parkinson's Law This law was presented by Cyril Parkinson and it states that "Work expands to the time allowed for it." It helps the project manager to understand that realistic timelines are important and do not waste any more time than required at an activity. 4. Carlson's Law Interrupted work will take more ti...

PPM vs Percentage Error

Image
  Parts per Million vs Percentage Error With the evolution of quality management processes in production industry and adaptation of lean manufacturing concept by the manufacturers, number of products with defects started to decrease with the time. Concept of 99.99% of accuracy is adopted by the developed countries. Once the concept of 0.1% of error was used by the manufacturers while defining the quality of their production. But now developed countries use the concept of parts per million to define the productivity of their process. Following figure can help to understand the difference between both concepts. In the above example, in a production out of 25,000 pieces, 50 pieces found to be defected. Now if we examine the both criteria: 1. Percentage Error If we look for percentage error, value is only 0.2% but as the denominator is 100 in this case which makes it look like an satisfactory/acceptable error in production. 2. Parts Per Million In this criteria, 50 pieces out of 25,0...